Showing posts with label sketchpad. Show all posts

Friday, October 26, 2018

The Orthocircle. Who knew?

I have been writing some support materials for the yet to be released Pattern Blocks+ mathies tool. I received feedback that many elementary teachers would not be familiar with the term "altitude", much less "orthocentre". It occured to me, that I knew about the incentre and incircle, the circumcentre and circumcircle, but couldn't recall ever constructing an orthocircle.

I read Math is Fun's Triangle Centers page and loved the visuals and interactive sketches, but they did not include an orthocircle. The page says that there are actually thousands of "centres" of a triangle, and I wonder if "interior points" was what was meant.

After a little more surfing, I wrote the following:

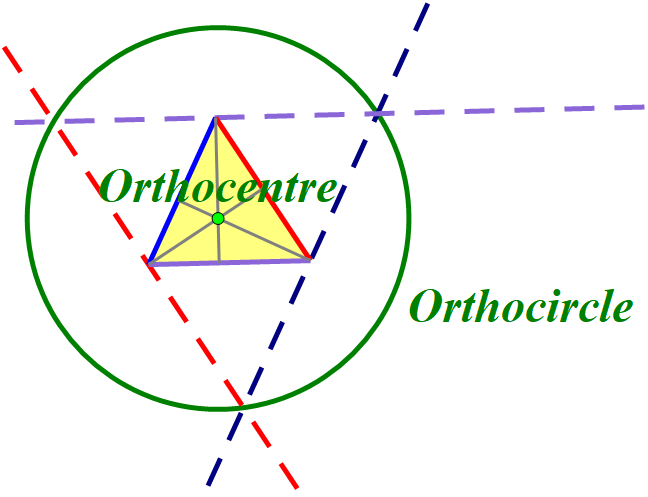
The three altitudes of a triangle always intersect in a single point called the orthocentre of the triangle. This point is the centre of a circle that can be constructed by creating a triangle with sides parallel to the original triangle through its vertices (see below). 
A construction of the orthocircle of a triangle 
It was nice to dust off The Geometer's Sketchpad again.

Is the orthocircle as new to you as it was to me?
Is what I have written accurate or is it better to say that this is one of many orthocircles?


My 11th blog anniversary went by on the 23rd.

Monday, May 15, 2017

Another visualization task

Here is another interesting setup, shared in Tom Steinke's OAME 2017 session.  I have seen circles around squares and circles inside squares, but not circles and squares sharing a baseline.

I think a student could do a lot of productive reasoning about what the situation would look like prior to using the interactive sketch.


  1. What does the rectangle look like at the extremes?
  2. Will the side be greater than or less than the diameter?
  3. What fraction of the side length of  the square do you think the diameter will be?
Opening the sketch and dragging the point, without showing the measurements, is interesting.  How close is a student's guess about where the position of the drag point must be for the rectangle to be a square?  How close is there estimation of the relationship between the square's side and the diameter?

Lastly, they could choose an arbitrary diameter, like 100, and see if they can verify the result. Surprisingly, everything comes out nice and evenly with narry a square root of two in sight!

Thursday, June 11, 2015

How do I Construct these Loci?

If you have two points, A and B,  in the plane and then determine a third point P by measuring the distances to the original two and having the sum of those distances constant, you define an ellipse.

PA + PB = k

Tracing out such a locus is a fairly standard thing that is done in Sketchpad by defining the sum as a segment, creating a point on the segment to partition the length in 2, creating a circle with each partition as a radius, and tracing out the intersections.


What if you have three points, A, B, and C, in the plane and then determine a fourth point P by measuring the distances to the original three and having the sum of those distances be a constant?

PA + PB + PC = k

Here, I have constructed the Fermat Point P[0] which is the point where the sum is a minimum.  Then I traced out three points with the constant sum approximately 10, 12 and 14 units.


I am looking for a more elegant way to trace out the locus corresponding to any given constant sum of distances to the vertices.  I would also like to know what the curve is called and whether there is a way to graph a relation with that shape.

I am calling on the vast readership and commenters to help!

Tuesday, June 2, 2015

An Interactive Version of the Triangle Investigation

In the previous post, I captured movies of my investigation with The Geometer's Sketchpad. Web Sketchpad allows for including an HTML 5 version of the sketch on a webpage, like this one.

Drag the yellow dot, currently on the triangle to trace out the various positions and area of the triangle.


Note that I have enforced the maximum side length of 10 in a very strange way. Can you describe what I have done? Can you do it in a similar or better way?

Where do you have to place the yellow dot in order to have an area of 0?

How can you drag the yellow dot to keep the area the same?

What other patterns do you see in the behaviour? (There are lots more in the previous post)

Thursday, May 21, 2015

Investigating Triangles

For some reason, I woke up this morning thinking about triangles.  Particularly triangles with longest side 10 units.  I thought that Sketchpad might be an interesting way to construct said triangles and investigate relationships between the lengths of the other two sides.

You can see that I ended up with a tan triangle on the left and a plot relating the two remaining side lengths.  The following videos step you through the process of creating the sketch and using it to investigate some very interesting questions about the boundary of the region on the right, isosceles triangles, right triangles, and maximal areas.

In Ontario, students in the Grade 9 Applied Level are expected to do investigations like this, although they start with rectangles - which seems more complicated.  They are expected to investigate figures with maximal area as well as 3D shapes.

You can download the sketch, but it is more fun to create it yourself.  I have captured my investigation in case it helps in the 12 videos below.  If you find that you have trouble motivating yourself to watch 12 fascinating videos, you could just watch the last one to get a sense of where the investigation ends up.

(You can click on the title to get the video in a new tab)


Constructing the Triangle
 

Constructing the Point representing Side Lengths

Constructing the x and y segments
 

Tracing the Side Lengths
 

Investigating the Region of Possible Side Lengths

Investigating the Boundaries of the Region

Reasoning about the Equations of the Boundaries

Investigating Isosceles Triangles
 

Investigating More Isosceles Triangles
 

Investigating Right Triangles
 

Triangle in a Circle
 

Investigating Area
 

Thursday, September 25, 2014

Display issues with The Geometer's Sketchpad

There are 21 Sketchpad sketches contained within mathclips.ca.  You can find them by clicking the search icon at the top of the page, choosing "GSP Files" from the Search within drop down list, and clicking Display All.


These sketches were created in version 4 of The Geometer's Sketchpad™, which was the version licensed by the Ontario Ministry of Education at the time.  In the process of updating them to version 5, particularly to allow use with the Sketchpad Explorer iPad app, we noticed some discrepancies in how the sketches displayed on different machines.  Interestingly, most sketches worked just fine on my Windows machine, running at 96 pixels per inch (ppi), and on my iPad, running at 72 ppi, which is also the resolution for Macs generally.

The biggest discrepancy was between two Windows machines.  On one, the sketch looked like:

and on mine it displayed the right, honest way:


After a bit of frantic emailing to our always helpful Sketchpad gurus, we discovered that there is a system setting which was different.  Navigating to the Display settings in the Control Panel, we could tell that the first machine had set the size of all items to more than Smaller  (on a Windows 7 machine this is called 125% or 120 ppi).


You can also see the difference if you go to the System tab of Advanced Preferences in Sketchpad, which are found in the Edit menu after the Shift key is held down.


The Screen Resolution of 37.795 px/cm is equivalent to 96 ppi and should remain at that value on Windows machines, even if Reset All Preferences is clicked.  If the value is something different, it can be edited on this screen and once Sketchpad is restarted, the sketch will look like what everyone else sees.

We have been using Sketchpad for a long time and had not run into this before.  It makes us worry about distributing sketches that might look awful at ppi settings that we have no control over.
Zooming Integers:Place Value

I had the opportunity to tweak one of the Dynamic Number project's sketches yesterday. Zooming Integers provides an interesting display using an exploding or zooming number line.  In Ontario, we use spaces rather than commas to separate digit groups (see http://physics.nist.gov/cuu/Units/checklist.html).  Our Grade 6 curriculum includes millions and the sketch only goes up to 100 000.  I was able to copy the 100 000 page, change two parameters (with a little digging) and get a page that starts with a number line from 0 to 1 000 000.  Ontario benefits from having a provincial license for The Geometer's Sketchpad so that students can access this material.

You can access the tweaked sketch from here.


Wednesday, February 11, 2009

Finding Points of Intersection with The Geometer's Sketchpad

So Frank asked me about finding intersections of plotted linear functions at our Web 2.0 session last week. It turns out that constructing the intersection of two lines is trivial but of two function plots is not.

I told him the story about how happy I was to have written a custom tool to take two linear functions as input and create their point of intersection for Stephanie. The .gsp file is here.

At least, I was happy until I asked my pal Shawn Godin about it and he very quickly created a sketch that takes two polynomial functions (and maybe other kinds), and the origin and plots the functions, creates a locus of all the points of intersection found using Newton's Method, and labels one of them. You can then drag the point on the locus through all the points of intersection. His .gsp file is here.

Guess which one of us is working on our PhD in Mathematics?

Thanks Shawn for giving me permission to share the sketch. I'll be curious to see if this post gets as much traffic as the post about graphing inequations in Sketchpad, which also reported Shawn's guru status in the Sketchpad community.

Friday, August 29, 2008

Some Nuggets from my Reader

Summer has not been a great time to absorb the material being fed to my Google Reader account. In fact, I have been practicing marking items read that aren't and unsubscribing from feeds.

I found four recent things quite interesting though.

1. Tim Hawes' post about Willingham's contention that learning styles don't exist. Have a look at the video posted at Tim's site and some of the references quoted in my comment. I will look forward to reading your musings on Tim's post.

2. Geoff Day, another commun-it blogger, pointed me to an interesting study about how counting is not dependent on having language to name numbers. It made me think of the EQAO tests.

3. At the recent GAINS-CAMPPP, I subscribed to a news feed about Keith Devlin, who commented on my recent post. There I found a long and interesting article from the San Francisco Chronicle about what algebra should be taught in schools. It also has some interesting quotes. My favorite was:
"Algebra ... the intensive study of the last three letters of the alphabet."


4. A post by Gary Stager suggesting ways to better the teaching of geometry (including use Sketchpad, use Logo (but not Scratch)).

Thursday, May 15, 2008

Graphing inequations and inequalities in Sketchpad

cclancy asked the following question in the Physics forum:

Does anyone know how to graph x > 7 with Geometer's Sketchpad? Is it possible?


I consulted the chief Ontario Sketchpad guru, Shawn Godin and then replied:

It is possible to graph inequalities on a number line or in the plane.

Shawn Godin supplied the first sketch and I am not sure where I picked up the other.


I have been collecting resources for Sketchpad, including the mathforum discussion group where questions like this are routinely and professionally answered. If you need any help deconstructing the methods used in either sketch above, you can contact me through my blog.

Hope this helps,

Ross


Update (May 16): The inequalities in the plane sketch was sent to me by Paul Kunkel in response to a question on the Math forum. Scott Steketee is offering a similar sketch with custom tools to generate the inequations from the mathforum discussion group.

Tuesday, May 13, 2008

Resources for The Geometer's Sketchpad

I have been keeping a list of resources for the Geometer's Sketchpad that I have been giving out at workshops and have posted to the OSAPAC Learning Objects Repository (where it is currently in the top 10 downloads). There are two problems with it:
  • it goes out of date
  • I am the only person who adds to it
To solve this, I have posted the document as a wiki page. Please feel free to edit it and add your favorite resources.

Friday, February 15, 2008

Fibonacci Gauge - part 2

The feedjit widget on my blog allows me to see where the readers come from, what page they are reading and to what page they leave. I find it interesting and encouraging. I noticed that a lot of readers are coming to my earlier post on the Fibonacci gauge, so I thought that I would outline a Geometer's Sketchpad construction of such a gauge.

Here are the steps that I followed:


Download the Sketchpad file.

Perhaps someone has a suggestion for an improved procedure or has a Cabri or Geogebra version.

Tuesday, January 29, 2008

Linkages, Sketchpad and YouTube

Nick Jackiw has a very interesting Geometer's Sketchpad sketch on linkages, which intrigued me. The whole collection is worth having a look at.

Today, I happened upon the video below. If you thought modeling the Fibonacci gauge was a challenge...


Monday, January 28, 2008

Fibonacci Gauge

I originally saw this at the magazine's site. I loved it and so did Ron Lancaster. Try making a Geometer's Sketchpad sketch of the gauge.

Wednesday, January 16, 2008

Strauss, Sketchpad, Photos, Quadratics and YouTube

I was hoping to post this from my new XO Laptop, but I have some figuring out to do about Flash, Opera, Linux and fat fingers.

However, I just had to post this video. Have you ever seen anything like it. Astonishing!