Wednesday, November 16, 2016

A little late to the US Election Party

You may have heard about the United States having an election recently.  In fact, all the talk about Florida and racial divisions might have reminded you of other recent elections.

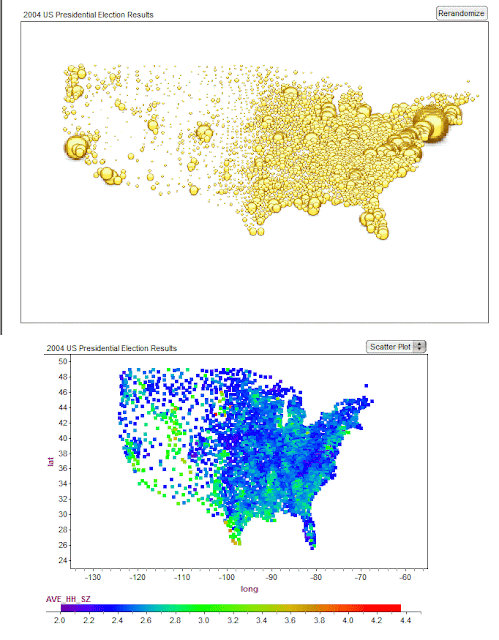
I spent some happy time after the 2004 election gathering data, by county, in a Fathom document.  I was inspired by some fascinating articles with incredible data visualizations:

The changing colors of America (1960-2004)

Maps of the 2016 US presidential election results (it used to be 2004)

and posed a few questions on The Math Forum.

Fathom is licensed by the Ontario Ministry of Education for use in its publicly funded schools and Ontario has an innovative Data Management course at the Grade 12 level.

Here are two of the plots that I created in Fathom which I also think are very cool - not quite as fancy as the ones above however.  These make you wonder where "middle America" has gone...


The comments related to the collection are worth a read.

Tuesday, February 9, 2016

Tribute to Bob Elliott

My dad used to listen to Gilmour's Albums religiously - it was Sunday after all.  Gilmour introduced me to Bob and Ray who I just loved.  Bob Elliott died a week ago, so I am embedding two of my favorites as a tribute.


Smart - like Shakespearean Baseball


Using a CLIPS Activity in SMART Notebook - Redux

In a post from 2009, Giancarlo Brotto explained how to embed .swf downloads from MathCLIPS into SMART Notebook.  This year, SMART Notebook will be moving away from Flash, and so Giancarlo has updated the video with three methods to embed CLIPS activities, games and tools into a Notebook file.  He even added some promotion for other SMART products, I guess that is what you do if you are Global Education Strategist for SMART.